What Happens After You Connect: Your First Two Weeks
You’ve connected your air conditioner to Hungry Machines. Here’s exactly what happens next — what we’re doing, when you’ll see results, and what the numbers should look like along the way. No magic, no black box: your home teaches us its physics, and we show our work.
Day 0: you start recording data
The moment your integration connects, your system begins recording a reading every five minutes: indoor temperature, what your AC is doing, and (if you have a circuit power meter or smart plug) its power draw. We also pull your local weather forecast.
That’s it for day 0. Nothing changes about how your home runs. We’re building the raw material for a thermal model of your rooms — not a generic house, yours.
Day 1: a short guided exercise
On the first suitable warm day, we run a one-time calibration: a six-hour window (9am–3pm) where we deliberately exercise your AC — a couple of hours of gentle cooling, a rest, a couple of hours of stronger cooling, another rest. It’s the fastest way to learn two things a passive week of data reveals only slowly: how quickly your AC can move the temperature, and how quickly your rooms drift back when it stops.
You can skip or postpone this from the app if the timing is bad. The model still gets built — it just takes a little longer to sharpen.
An honesty rule we hold ourselves to from day 1: every model we deploy has to prove it predicts your home better than the simplest possible alternative — assuming the temperature simply doesn’t move. On day 1, with only hours of data, a fitted model often can’t beat that bar. When it can’t, we don’t use it. We’d rather tell you “still learning” than pretend.
Days 2–3: your first real model — and your first optimized schedule
This is where it gets interesting. We replayed the pilot homes’ history to measure exactly this ramp: by day 2–3, the best model for each home predicted the next day’s indoor temperature 45–77% more accurately than the no-model baseline. In plain terms: after two or three days, we can simulate your building well enough to plan against it.
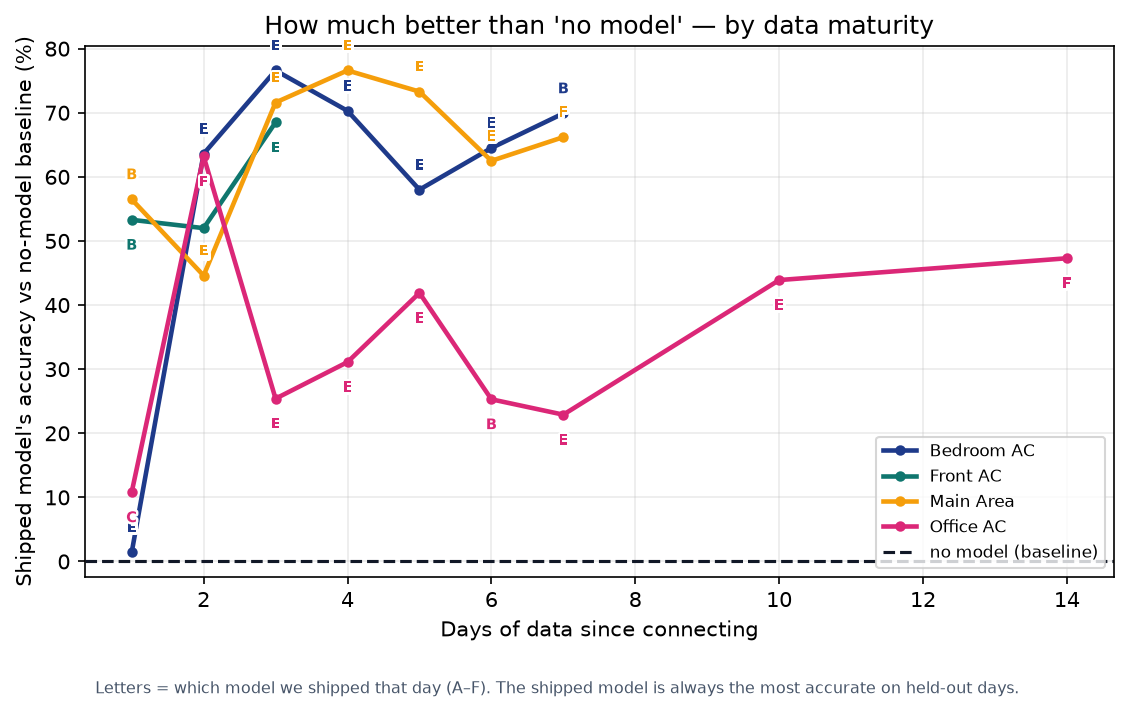
Four pilot units, each scored against a “the temperature won’t move” baseline. Each line follows the model we actually ship that day — always the most accurate one — and the letter tags name which candidate that was. Every unit crosses 45% better within two to three days of connecting, which is where we can start planning against your home with confidence.
So we start planning. Every night, we take tomorrow’s weather forecast, your electricity prices, and your comfort settings, and search for the cheapest schedule that keeps you inside your comfort band — usually by cooling a little more when power is cheap and coasting on your home’s previous cooling when power is expensive.
What the plans look like in the pilot data so far:
- On days with room to optimize, the planned schedule projects typically 25–60% lower HVAC running cost than holding a fixed setpoint (median around 40–45%).
- On roughly 3 days in 10, we ship 0% — genuinely. Mild days, flat prices, or tight user constraints leave little worth shifting. We will never ship a plan that costs more than doing nothing, and we won’t invent savings that aren’t there.
(These are projected savings on the HVAC portion of your bill, measured against a thermostat held at the middle of your comfort band — not your whole utility bill. As our fleet grows we’ll publish measured, not projected, numbers.)
Week 1–2: your model earns its details
Every night for your first two weeks, we refit your model with the newest data. And it’s not one model — several candidates compete on your home’s history, each scored on days it never saw during training (holdout data). The winner gets tomorrow’s job.
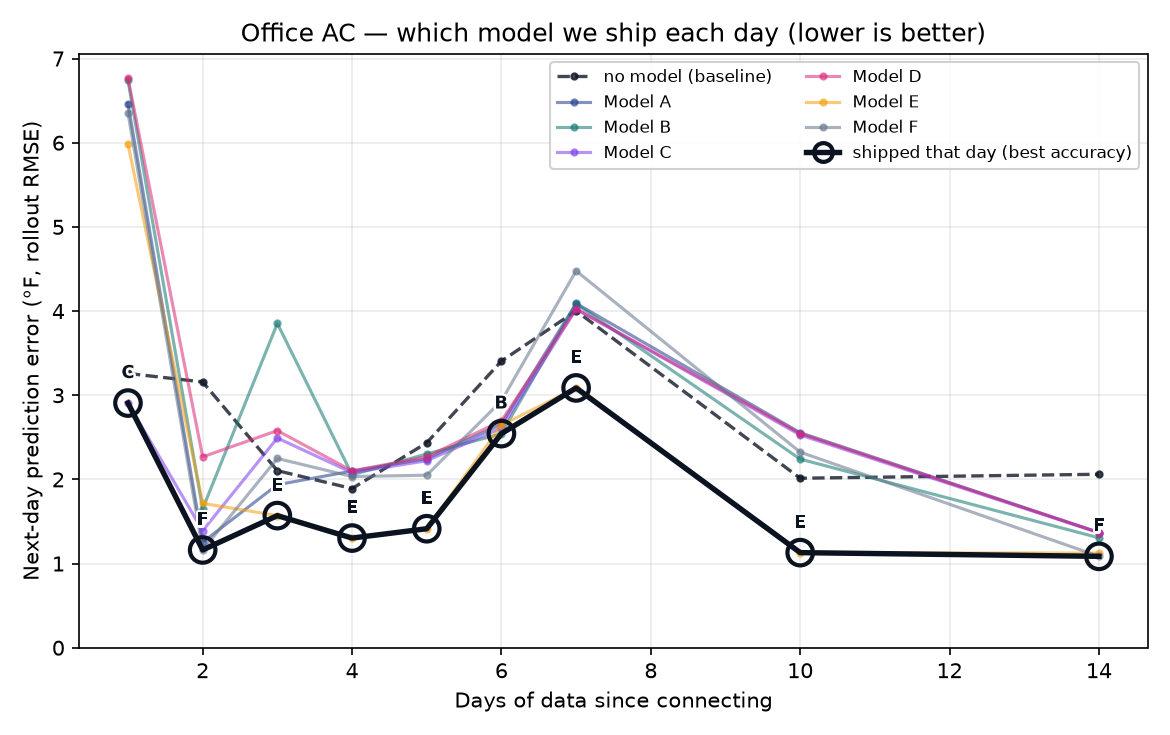
One home’s model competition. Each thin line is a candidate; the bold line is the one we actually ship that day — whichever is most accurate — tagged with its letter. A simple model wins the first week (the “E” tag); the detailed physics models earn their place and take over by week two (the “F” at day 14). Every line is scored on days the model never trained on.
Two things we learned from the pilot that might surprise you:
- The early winner is usually the simple model. In the first week, a straightforward “how does this room chase its thermostat” model beats the fancier physics on most homes. The detailed physics — how your walls store heat, how your AC’s output varies with load, how humidity eats cooling capacity, your home’s daily rhythm of people and equipment — typically earns its way in during week two, one proven term at a time.
- More data genuinely means better plans. The prediction-error curves fall week over week, and every specialized term has to win a head-to-head test on your home before it ships. Nothing is assumed because it worked on someone else’s house.
After two weeks, refits settle to weekly — your model keeps up with the seasons without churning.
What you should expect
- Days 0–1: nothing changes; readings flow; maybe one guided calibration.
- Days 2–3: first optimized schedules appear. Check the app’s plan view — every scheduled action shows its reasoning.
- Week 1–2: projected savings stabilize; the model badge may change as candidates trade places. That’s the competition between thermodynamic models working, not indecision.
- Any day: your comfort band is the constraint we optimize inside, never a suggestion. If the plan can’t stay in the band, it falls back to a model that does.
The pattern to take away: day 0 we listen, day 1 we learn your AC, days 2–3 we start saving, and by week two your home has a model that has beaten every alternative on its own data. That’s the whole trick — and it’s not a trick.
Questions about connecting your system? See the install guide, or write to info@hungrymachines.io.